Peering telemetry is a visualization demonstration that uses the capabilities of Nokia SR OS and SR Linux routers show the potential of gRPC streaming telemetry using open source tools. The Nokia Network Services Platform (NSP) also provides a commercial software solution for using gRPC telemetry.
By harnessing the power of real-time telemetry data collected from routers connected to DE-CIX internet exchanges, peering telemetry demonstrates what internet peering statistics can be monitored. Streaming telemetry dashboards, such as the dashboards in the demonstration created using Grafana, give instant access to a wealth of information about system and control plane performance, routing and peering information, and potential issues, all presented in a user-friendly visual format.
For general information on gRPC telemetry and why it is a better alternative to SNMP, read Streaming telemetry with open source gNMIc.
Get inspired! Access the dashboards and learn how the data is collected, visualized, and analyzed. We hope that this will inspire you to build your own telemetry solutions and to share them with the network operator community yourself.
This demonstration project is developed by Nokia with interconnection services provided by BSO and DE-CIX.
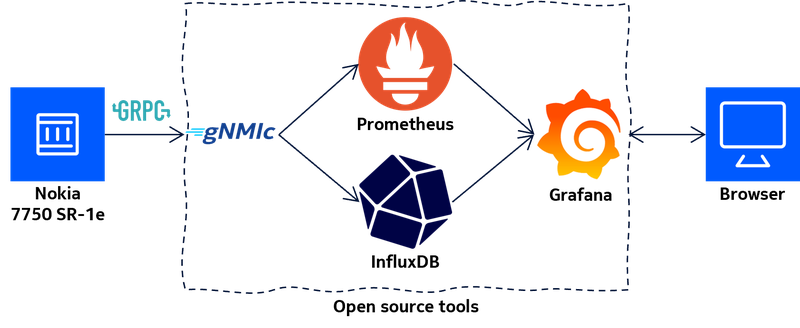
The dashboards used to visualize peering telemetry are generated using a number of open source tools running in containers.
| Role | Software |
|---|---|
| Telemetry collector | gNMIc |
| Time-series database | Prometheus |
| Time-series database | InfluxDB |
| Visualization | Grafana |
gNMIc is a gNMI CLI client that provides full support for Capabilities, Get, Set, and Subscribe RPCs with collector capabilities. It subscribes to streaming telemetry data from the router over gRPC/gNMI and exports the data to the databases.
Prometheus is an open source time-series database. It is used in this project to store the SAMPLE telemetry data exported by gNMIc for statistics.
InfluxDB is an open source time-series database. It is used in this project to store the ON_CHANGE telemetry data exported by gNMIc for events.
Grafana is an open source analytics and interactive visualization web application that provides charts, graphs, and alerts. It can also visualize data from multiple input sources. The dashboards provide multiple views of the collected real-time data.
These examples provide ideas on how data can be visualized to inspire you on your automation journey.
 /
/